METROSION Metrology to enable high temperature erosion testing
Work Packages
Work Package 1: Materials
This work package focuses on the selection and preparation of materials required for the project. It is essential that common materials are used across the work packages and laboratories; therefore a common source of substrates, coatings and erodent will be identified and used.
Two substrate materials have been selected after consultation with the Industrial Stakeholders. These are Nimonic 80A and X22 Steel. Quantities of both of these substrate materials have been kindly supplied to the project by Alstom Power UK. In addition to the substrate materials, the project also wanted to assess the erosion behaviour of a range of different coatings. Four coatings have been selected (Stellite 6 applied using laser cladding by Laser Cladding Technologies Ltd., AlTiN coating applied by Wallwork Ltd, and a thicker High Velocity Oxy Flame (HVOF) coating applied by Praxair Surface Technologies. These coatings have been applied to the Nimonic 80A substrates and will also be applied to the X22 material for comparison. A fourth novel coating is being developed by Cranfield University for inclusion in the test programme.
In addition to the specimens, a number of erodent powders have been sourced. These include:
- Alumina
- Silica
- Rounded
- Angular
- Fly Ash
- Chromia
To help with the understanding of the erosion results and aid the modelling activities within the project it is important to characterise the specimen and erodent medium. Critical parameters needed have been measured on the substrate materials and the erodents. The measurements and techniques used are presented in the table below. An example of the results can been seen by selecting the appropriate links.
|
Parameter |
Substrate |
Erodent |
|||||
|
|
Nim 80A & X22 |
EPRI Alumina |
Alumina |
Silica Rounded |
Silica Angular |
Fly Ash |
|
|
Optical, SEM |
|||||||
|
Scanning Indentation Microhardness Measurement System |
N/A |
||||||
|
Density |
Archimedes Principle |
||||||
|
Chemical Composition |
Supplier Data Sheet |
X-ray Diffraction, SEM EDX |
|||||
|
Scratch Test |
Scratch Tester |
N/A |
|||||
|
Impact Excitation |
N/A |
||||||
|
Dilatometry |
N/A |
||||||
|
Thermal Diffusivity |
Laser Flash |
N/A |
|||||
|
Fracture Toughness, KIC |
Four Point Bend |
|
|
|
|
|
|
|
|
|
Optical, X-ray Computed Tomography, Light Scattering |
|||||
|
|
|
|
|
|
|
|
|
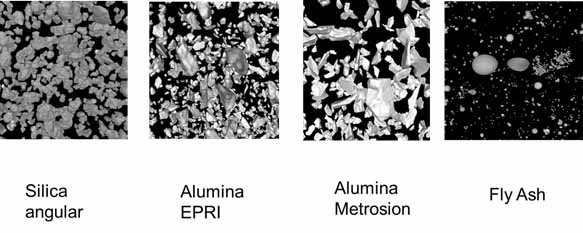
Examples show images of the rounded silica erodent compared to the angular silica erodent. Images obtained using a scanning electron microscope.
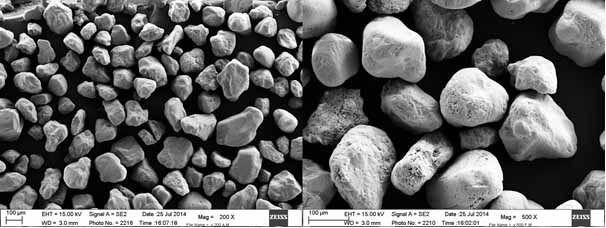
SEM images of the rounded silica erodent (MIL-E-8593A Sand)
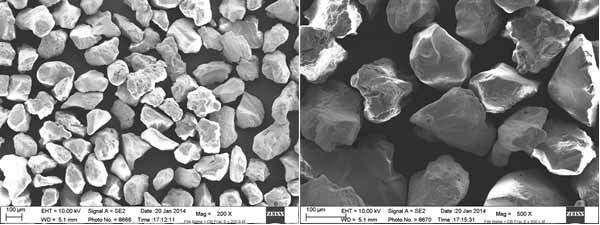
SEM images of the angular silica erodent David Ball Fraction E Sand
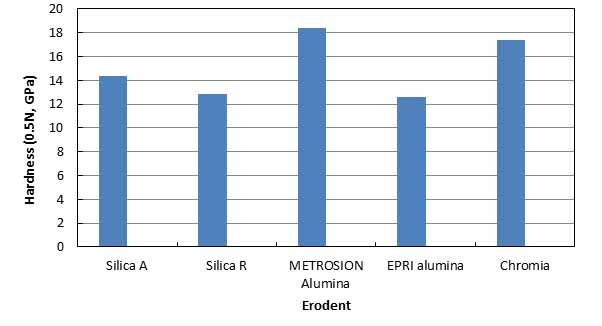
To measure the hardness of the erodent particles, samples were produced of erodent powder encased in an epoxy resin. Once manufactured the surface of the samples was polished with colloidal silica to produce a plane flat surface.
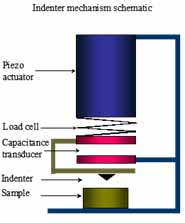
Hardness maps were produced with a Scanning Indentation Mechanical Microprobe (SIMM). Each sample was placed on a rigid motorised table beneath the indenter mechanism, the construction of which is shown schematically below:
For each erodent 100 indents were made with the aim of generating hardness data where the indent was within the particle. Given the random distribution, powder size and indiscriminate placement of the indents there is an unavoidable scatter in the indent placement. As a consequence a mean hardness value for the erodent powders has been reported based on the average value of the maximum 10% of the data, which is assumed to have fallen within the erodent particle, as shown below:
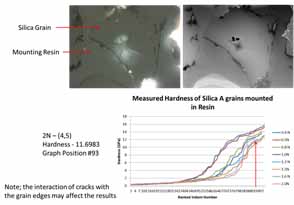
The mean hardness values are shown for a selection of the erodents below:
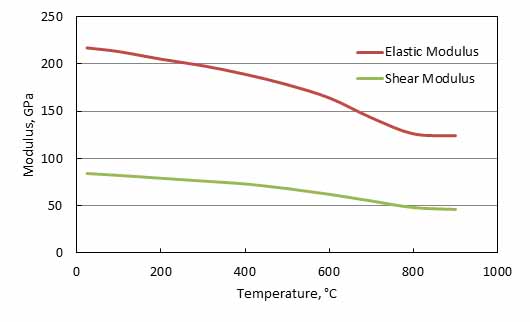
The dynamic Young's modulus, shear modulus and Poisson's ratio has been measured as a function of temperature using the test method described in ASTM E1875:2008. This test method measures the resonant frequencies of the test specimen, usually a bar of rectangular cross section of uniform thickness with plane parallel ground faces. This specimen is then excited at continuously variable frequencies. Mechanical excitation of the bars is provided through the use of a transducer that transforms a cyclic electrical signal into a cyclic mechanical force on the specimen. A second transducer senses the resulting mechanical vibrations of the specimen and transforms them into an electrical signal. The amplitude and frequency of the signal are measured by an oscilloscope or other means to detect resonance. The resonant frequencies, dimensions, and mass of the specimen are used to calculate dynamic Young's modulus and dynamic shear modulus.
An example of the results for X22 from room temperature to 900 °C are shown below:
Coefficient of thermal expansion measurements have been performed on the X22 alloy, the specimens used were tested in a modified Linseis dilatometer. The instrument operates in the horizontal mode with specially constructed alumina apparatus comprising a tube with a end flat against which the test-piece is pushed by an alumina push-rod. The push-rod transmits the changes in length to a linear displacement transducer as the test-piece is heated and cooled. The temperature of the test-piece is measured using a type R thermocouple, and the outputs of the thermocouple and the transducer are recorded at two-minute intervals on a data logger for later analysis.
The overall accuracy of the measurement is controlled by the mechanical stability of the specimen in the apparatus. Assuming complete stability, the measurement accuracy is considered to be approximately � 0.1 x 10⁻⁶ °C-1 over a 100 °C temperature range.
Three repeat cycles consisting of a heating stage from 25 to 900 °C and a cooling stage back to 25 °C were completed for each material, with the mean data being calculated from suitable cycles. The mean coefficient values plotted with respect to temperature are shown below:
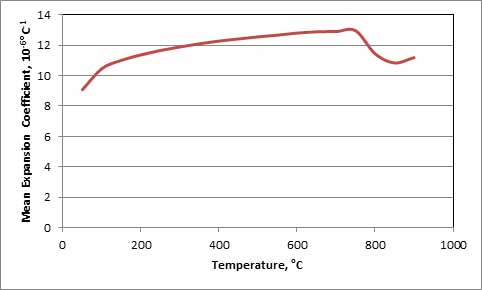
The data shows that the CTE rises to a maxima at ~750 °C, but then drops, and then starts to rise again. This is also seen in the thermal diffusivity data. This physical change in properties is a result of a phase change from an FCC to BCC structure as the sample temperature passes through the Curie point. For iron the Curie temperature is 771 °C which corresponds well with the point at which the properties change dramatically.
The size distribution of the powders has been measured using a light scattering technique, X-ray computed tomography and optically using an image analysis routine developed within the METROSION project. The results from the different techniques are shown in the table below for the two alumina powders. The results show that there are differences between the values measured but given that there is a size distribution in the powders there is a significant overlap in the values reported to provide confidence in the different methods.
|
Erodent |
Light Scattering Method |
X-ray Computed Tomography |
Optical Analysis |
|||
|
d(0.1), µm |
d(0.5), µm |
d(0.9), µm |
Particle Size, µm |
Equivalent Radius, µm |
Equivalent Diameter, µm |
|
|
METROSION Alumina |
78 |
123 |
191 |
100 |
73 |
146 |
|
EPRI Alumina |
33 |
52 |
81 |
48 |
28 |
56 |
Work Package 2: Test rig development, effect of test parameters and modelling
This work package focus is on the construction of novel test systems which will incorporate the advanced metrology techniques allowing in-situ measurements, and the development of modelling approaches for particulate erosion./p>
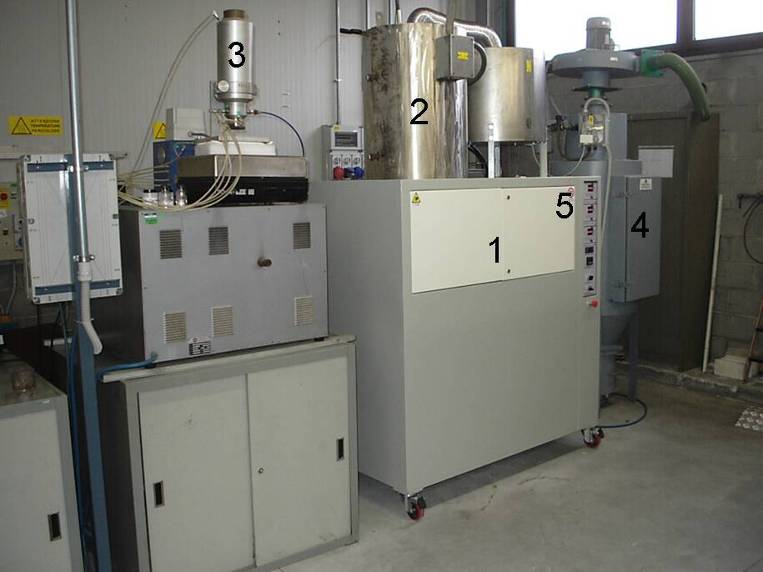
Two novel test systems are being designed and built at NPL and BAM. The system at NPL is based on a conventional particulate erosion rig, but is designed to operate at high temperature and high velocity, incorporating advanced metrological devices to capture high speed images of the particles during the test. The apparatus has been designed to allow in situ measurement of the particle velocity and velocity distribution, measurement of the particle and specimen temperature and distribution, and measurement of the mass change and volume change caused by the erosion process. Incorporation of these in situ measurements greatly improves the control and measurement of high temperature particulate erosion, and will reduce the time needed to generate an erosion curve for a material at high temperature. The designed specification of the apparatus is as follows:
- Maximum velocity of 300 ms-1
- Maximum operating temperature of 900 °C
- 5 mm nozzle diameter to aligned with proposed ASTM standard
- In situ mass measurement (when no gas flow) with 0.01 mg sensitivity
- In situ measurement of crater volume
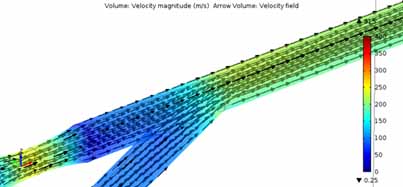
The design of the apparatus has been aided by multi physics modelling to determine the necessary nozzle geometry required to attain the design requirements. An example of this work is shown in the figure below. This shows the velocity of the gas along the main nozzle and also in the powder feed line. Note that gas flow and velocity in the main line is not affected by the powder feed. A paper detailing this work is currently under preparation.
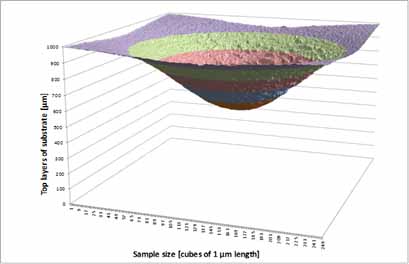
The metrology possible within this project will furnish modellers with the required input parameters and mechanistic information to realise improved modelling. Within METROSION three distinct modelling approaches are being developed. The first is based on the particle kinetic energy distribution. This used a step-based approach where each particle impact is considered as a single event. A Monte Carlo simulation method is then used to determine a result of the impact based on the particle kinetic energy. An example of the preliminary results from the model is shown below:
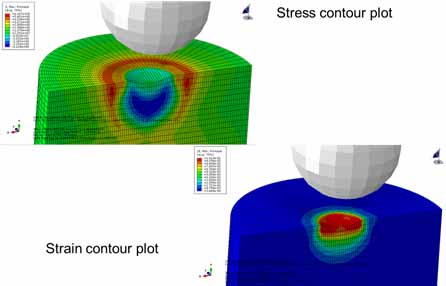
The second approach uses finite element modelling to examine the stresses that are generated when particles impact onto a surface using an elastic-plastic stress analysis for both the erodent particle and the surface of the material under test. Abaqus/Explicit is being used to generate a dynamic FE model. An example of the stress and strain contours from the model are shown below. Further work is needed to develop and validate the model.
The third approach employs linear-elastic crack propagation to model to erosion rate of thermal barrier coatings.
The models developed in this task will be compared with the results of experiments carried out in the rest of the project to assess the validity of the models.
Work Package 3: Volume and Mass measurement
This work package is focused on the measurement of mass and volume. In particular we are interested in measuring and characterising the shape and size of the erodent particles: by attributing a number to a characteristic parameter of the particles we can begin to describe and understand the erosion process in a more precise manner.
To do this a number of different measurement techniques have been employed, these include light scattering, X-ray computed tomography (XCT) and optical image analysis.
PTB has conducted XCT scans of the erodents (shown below), analysis of 3D data has provided the possibility to calculate different equivalent diameters for the powder particles. Besides the volume-equivalent diameter, which requires the 3D information of the CT measurement, the volume of the particles can also be projected onto a 2D area. This data has been used to calculate the area-equivalent diameter of the particles. These measurements help researchers and modellers to characterise the size and shape of the particles helping to establish just how damaging the particles are likely to be to the specimen surface.
Since optical measurements techniques, like light scattering (performed at RSE) or with optical analysis (performed at NPL), determine the area-equivalent diameter, it was possible to compare CT results with light scattering or optical results.
This has shown that light scattering techniques tend to over-estimate the volume of the particles.
|
Erodent |
Light Scattering Method |
X-ray Computed Tomography |
Optical Analysis |
|||
|
d(0.1), µm |
d(0.5), µm |
d(0.9), µm |
Particle Size, µm |
Equivalent Radius, µm |
Equivalent Diameter, µm |
|
|
METROSION Alumina |
78 |
123 |
191 |
100 |
73 |
146 |
|
EPRI Alumina |
33 |
52 |
81 |
48 |
28 |
56 |
In addition to the measurement and characterisation of the erodent powders, this work package is also developing advanced techniques to measure and characterise the volume and mass change of the test piece in situ to establish the erosion rate during the test. Measurements will also be performed off-line giving particular emphasis to the combined effect of corrosion and erosion to establish reliable base lines. To understand the uncertainties in these measurements an intercomparison exercise has been run between the JRP partners to determine the intra- and inter-laboratory repeatability and reproducibility of mass and volume measurements of eroded samples.
This intercomparison involved NPL, PTB, BAM, RSE and Cranfield University. The substrates (X22 and Nimonic80A) were measured optically (e.g. Alicona G4 shown below) and with a tactile probe before and after an erosion scar was applied. Additionally the substrates have been weighed with high resolution scales (e.g. Mettler Toledo XP205CDR), before and after erosion.
The preliminary results of this intercomparison showed good inter and intra-laboratory comparability of the mass measurements, but much more variability in the measurement of the volume of the erosion scar. This may be due to the analysis methods used by the laboratories and the difficulties in determining the original surface from which the datum of the measurement could be taken. Work is ongoing to understand these issues further.
Work Package 4: Velocity, temperature and flow
Work package 4 is focused on the measurement of the velocity and temperature of the gas and erodent particles and the control of the flow of the jet as it exits the nozzle of the erosion apparatus.
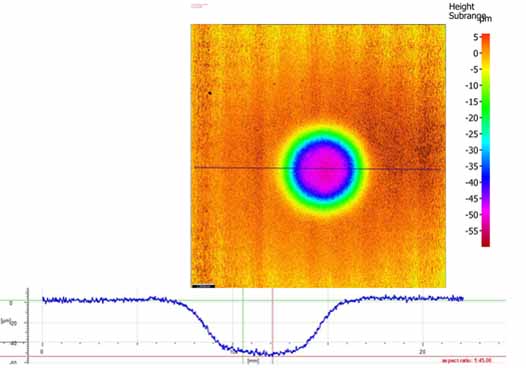
The first step in improving a measurement is to understand what is currently achieved. For particulate erosion testing the particle velocity (mean) is measured using a double disc method. The double disc system consists of a pair of metal discs mounted on a common shaft. The shaft is connected to a motor that enables the discs to rotate constantly at a set voltage, and hence a known speed (measured with a tachometer) below a gas-particle flow. Two single radial slits in the top mounted disc permits particles to pass through and eventually erode a mark on the disc. Two erosion exposures are made, one with the discs stationary and the other with the discs rotating. Two pairs of erosion marks are thereby produced on the disc. A measurement of angular displacement between these two marks gives time of flight of the particles as they cross the space between the discs. An example of the measurement scar on the surface of the disc is shown below. This image has been obtained using a 3D optical microscope.
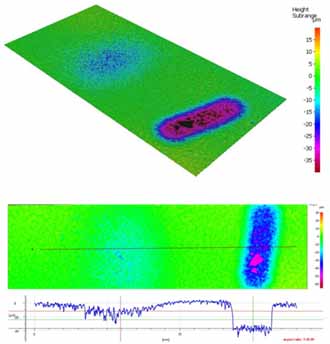
The following parameters are used with the equation shown to calculate the particle velocity:
d = distance disc travels
D =Diameter of disc
S = measured separation of erosion marks
H = Nozzle height

And:
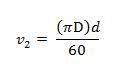
Analysis of routine velocity measurements has shown that the double disc method can have uncertainties in the order of 20 to 30%.
Improved methods, other than those currently used, of non-contact velocity measurement such as Laser Doppler Anemometry (LDA) and pulsed laser are being developed at DTU to measure the velocity of the particles thereby enabling greater precision in the measurement of the particle velocity and the spread in the particles as they exit the nozzle. This will increase the reliability of the erosion test and also aid in the modelling of the process as a more reliable figure for the kinetic energy of the particle can be ascertained, since at present there is a potential for a 60% error in the kinetic energy calculation.
The research within this EURAMET joint research project receives funding from the European Community's Seventh Framework Programme, ERA-NET Plus, under Grant Agreement No. 217257.