
REG Gravity potential for optical clock comparisons
Gravity observations at and around optical clock comparison sites
Background
Frequency comparisons between optical clocks at different locations require precise knowledge of the gravity (gravitational plus centrifugal) potential at the respective clock positions in order to be able to correct for the relativistic redshift of the clock transition frequencies. According to the laws of general relativity, one part in 1018 clock performance corresponds to about 0.1 m2s-2 in terms of the gravity potential, which is equivalent to 1 cm in height. The new optical atomic clocks currently under development are targeting this level of accuracy, and hence knowledge of the gravity potential corresponding to one centimetre in height is required, which is significantly beyond the current state-of-the-art on a global scale. In this context, local and remote clock comparisons require only gravity potential differences, but for a future integration of the optical clocks into international timescales, the absolute potential values relative to a defined reference surface are required as well.
The determination of the gravity potential is one of the primary goals of geodesy, as all other relevant gravity field parameters can be derived from it, and as it is the ideal quantity for describing the direction of water flow. In principle, the gravity potential or corresponding potential differences can be determined by two different classical geodetic approaches. The first most direct and accurate geodetic approach over short distances is the geometric levelling technique (plus gravity observations), which initially delivers only potential or height differences with respect to a conventional datum point (typically attached to a tide gauge and mean sea level MSL); it can achieve mm or even sub-mm (relative) accuracy, but as it is a differential technique, it is also susceptible to systematic errors, which may accumulate to the decimetre level over longer distances of 1,000 km or more. The second approach is based on the results of gravity field modelling (e.g. disturbing potential, geoid, quasigeoid; based on the geodetic boundary value problem (GBVP) theory) and GNSS (Global Navigation Satellite System) positions; this way is also denoted as GBVP/GNSS or geoid/GNSS approach and requires gravity information all over the world, which is solved nowadays by a combination of global satellite models with regional terrestrial gravity data sets. Both approaches have their own particular strengths and limitations, with the geometric levelling technique giving superior accuracies over shorter distances (few km), while the GBVP/GNSS approach should be beneficial of longer distances (1,000 km and more).
In order to allow the implementation of both aforementioned approaches for the inter-connection of the optical clocks at the respective national metrological institutes (NMIs), common GNSS and levelling points are being established at each NMI site based on the recommendations developed within the REG.
Gravity observations
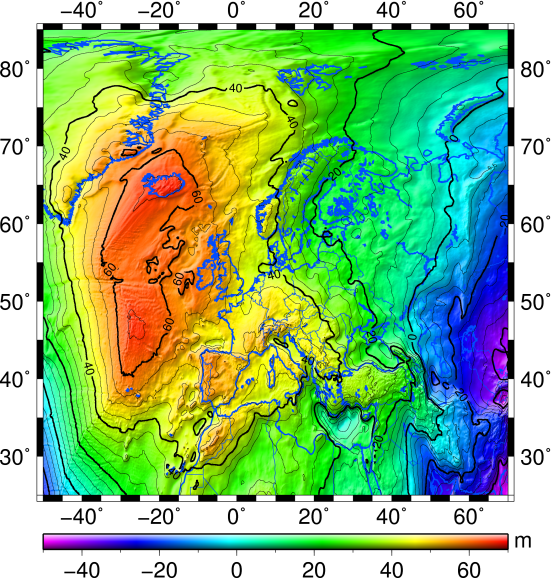
Fig 1: European gravimetric quasigeoid model EGG2008
Regional terrestrial gravity observations are one of the key components for the computation of high-precision global and regional geopotential models (geoid, quasigeoid), which in turn are important for deriving the gravity potential and differences thereof, especially with regard to remote clock comparisons over large distances.
Within the framework of the REG, spot check gravity observations are performed at and around each relevant clock comparison site in order to validate and improve the existing gravity database, with the final goal of upgrading the recent European gravity field model EGG2008 (European Gravimetric Quasigeoid 2008; see Fig 1). The new gravity observations include at least one absolute gravity observation at each clock comparison site, as well as additional connected relative gravity observations in the surrounding area. The relative gravity observations are carried out on selected points from the database for evaluation purposes and in areas devoid of gravity data so far for improving the data coverage and field modelling.
During a first measurement campaign in September 2013, gravity observations were carried out at and around Turin (INRIM, Istituto Nazionale di Ricerca Metrologica) and the Fréjus tunnel near Modane (collaborator LSM, Laboratoire Souterrain de Modane). Starting with an absolute gravity observation with a FG5X-220 free-fall instrument at each clock site, further relative gravity observations were performed with a Scintrex CG3M and a LaCoste & Romberg gravimeter (Figs 2 and 3). For the purpose of precise positioning, Real Time Kinematic GNSS observations were used within the national GNSS reference station networks. In total, 35 and 122 relative gravity points were measured around INRIM and LSM, respectively (Figs 4 and 5).
Similar gravity surveys were carried out in March 2014 at and around the clock sites in Braunschweig (PTB, Physikalisch-Technische Bundesanstalt) and London (NPL, National Physical Laboratory), starting again with an absolute gravity observation at each site, followed by relative gravity observations in the surrounding area, yielding 36 and 63 points, respectively. A further gravity measurement campaign was carried out in October 2014 at and around the clock sites in Paris (OBSPARIS, Observatoire de Paris).
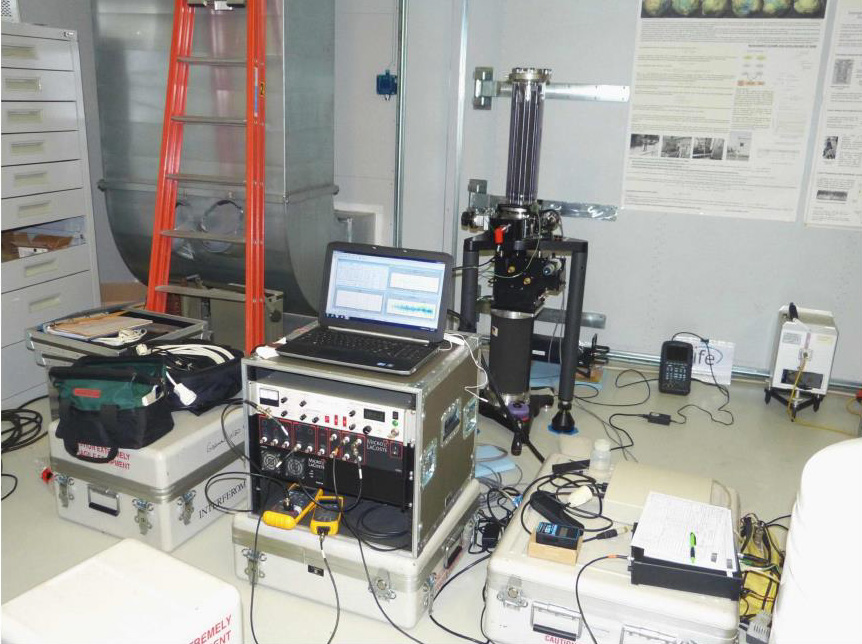
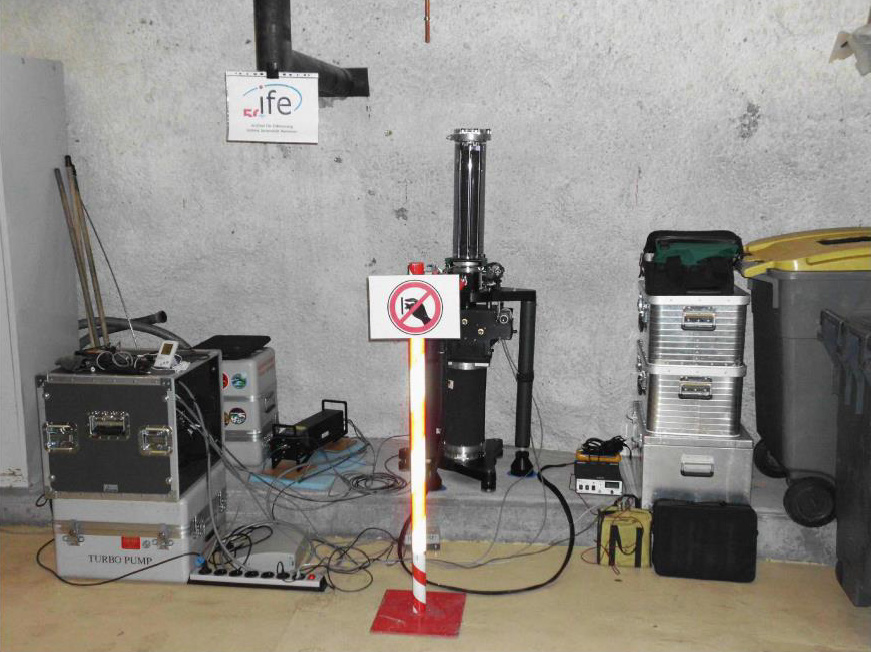
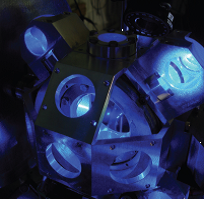
Fig 2: Absolute gravity observations with the FG5X-220 gravimeter in Turin (left) and in the Fréjus tunnel (right)
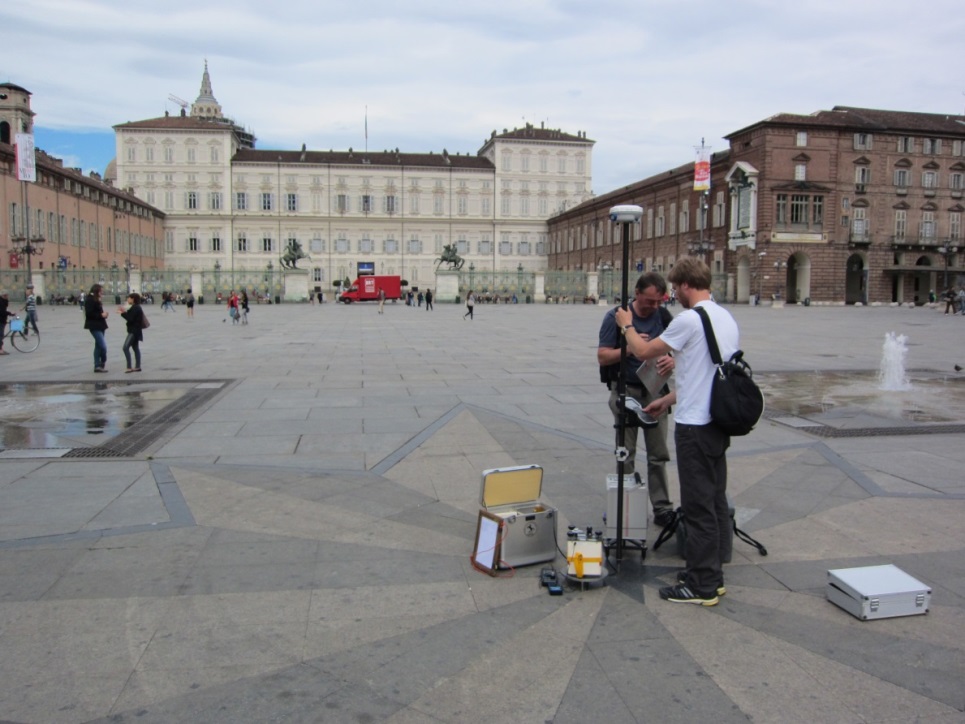
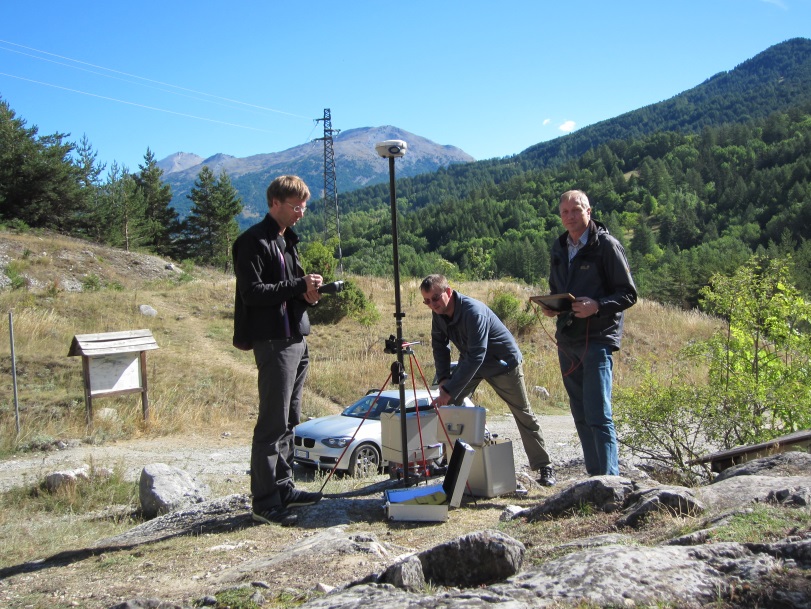
Fig 3: Relative gravity observations with a Scintrex and Lacoste & Romberg gravimeter in Turin (left) and around the Fréjus tunnel (right), both in connection with Real Time Kinematic GNSS observations.
© OpenStreetMap contributors
Fig 4: Gravity observations in Turin, Italy, including the new absolute gravity point (red triangle), new relative gravity points (red dots), and existing database points (black dots);
© OpenStreetMap contributors
Fig 5: Gravity observations in and around the Fréjus tunnel between Italy and France, including the new absolute gravity point (red triangle), new relative gravity points (red dots), and existing database points (black dots);
The research within this EURAMET joint research project receives funding from the European Community's Seventh Framework Programme, ERA-NET Plus, under Grant Agreement No. 217257.