Comparison with predictions
NPL Wraysbury
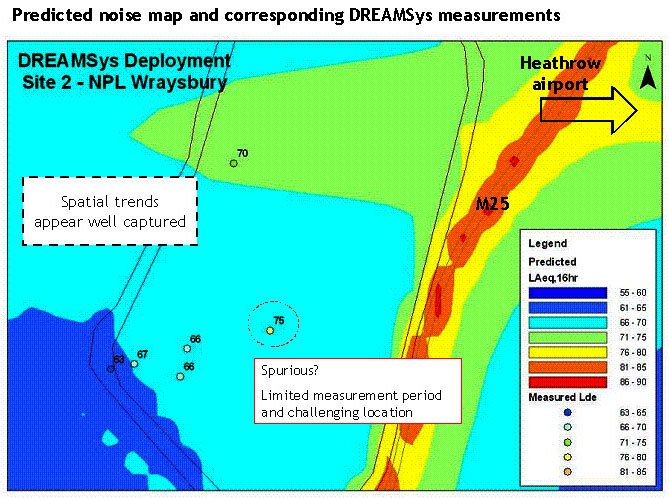
The predicted noise map below shows a clear evidence of the influence of Heathrow airport and the M25 motorway, which are both in proximity to this site. The location of DREAMSys nodes is marked, the number alongside denotes the measured level which is the long-term average day-evening LAeq,16hr or Lde.
Despite limited data filtering (e.g. for the effect of wind or rain), and the relatively sparse deployment due to the limited number of locations available, spatial trends appear to be consistent with the predictions. Additional deployment along the shore, particularly along the eastern edge of the reservoir would provide further interesting data, but security and safe accessibility limitations prohibit this.
In addition to the data shown, DREAMSys can also show temporal trends in the noise. For example, statistics on the distribution of the noisiest events and quietest periods can be derived, and the typical variability of noise levels examined in detail. Such information not available for predictions can provide very useful insights to the model results. Examining differences between the A-weighted and C-weighted data also highlights any significant low frequency component in the noise.
Silvertown Quays
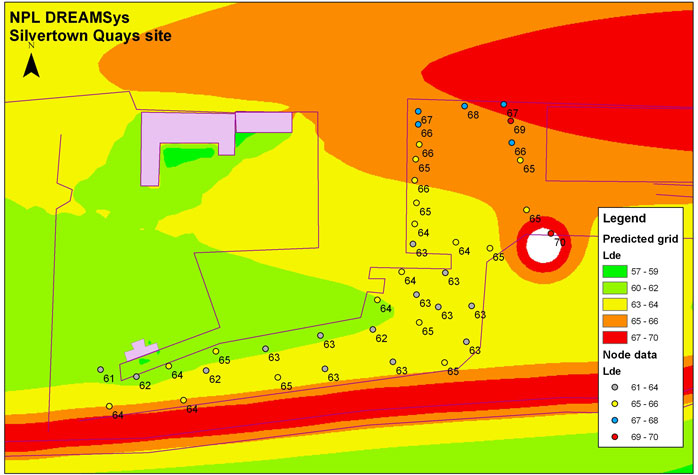
Below is a preliminary predictive noise model, which only included the aircraft movements from the London City airport, as the dominant noise source with information publicly available. An equivalent model for the night-time was not available as the airport does not operate at night.
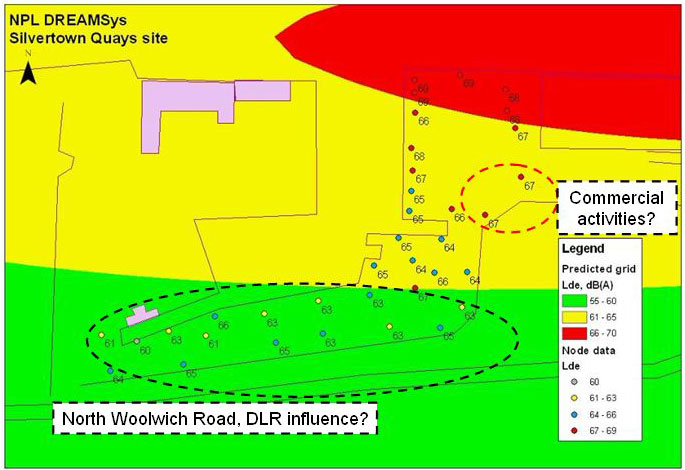
The data derived from the analysis of the measurement locations close to the aircraft flight path are in good agreement with the predictions. At the southern part of the site, owing to the influence of the road and rail traffic, the noise levels derived from the measurement data are higher than the predictions based on air traffic only. Likewise, a commercial source was found to be clearly dominant over a limited area to the east of the site. A revised prediction model was then produced based on the extensive measured data (see below). As shown, it captures more accurately the spatial distribution of the environmental noise levels.
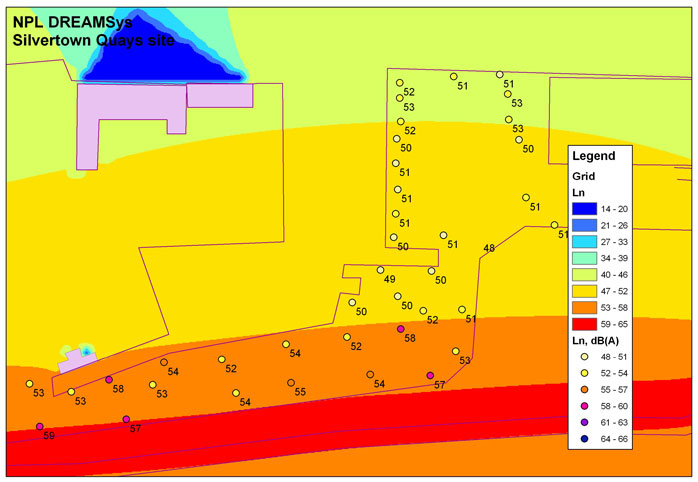
Accordingly, a predictive model was developed for the night-time period by making reference to the measured data. This model was produced by matching it to the measurements locations closest to the road and rail to the south of the site. However, the measurement results exhibit less decay in the noise levels further away from the source as expected from the model, implying the presence of a "noise floor" which is typical of any urban environmental setting and would be difficult to represent in most predictive models.