Characteristics
Pressure responses
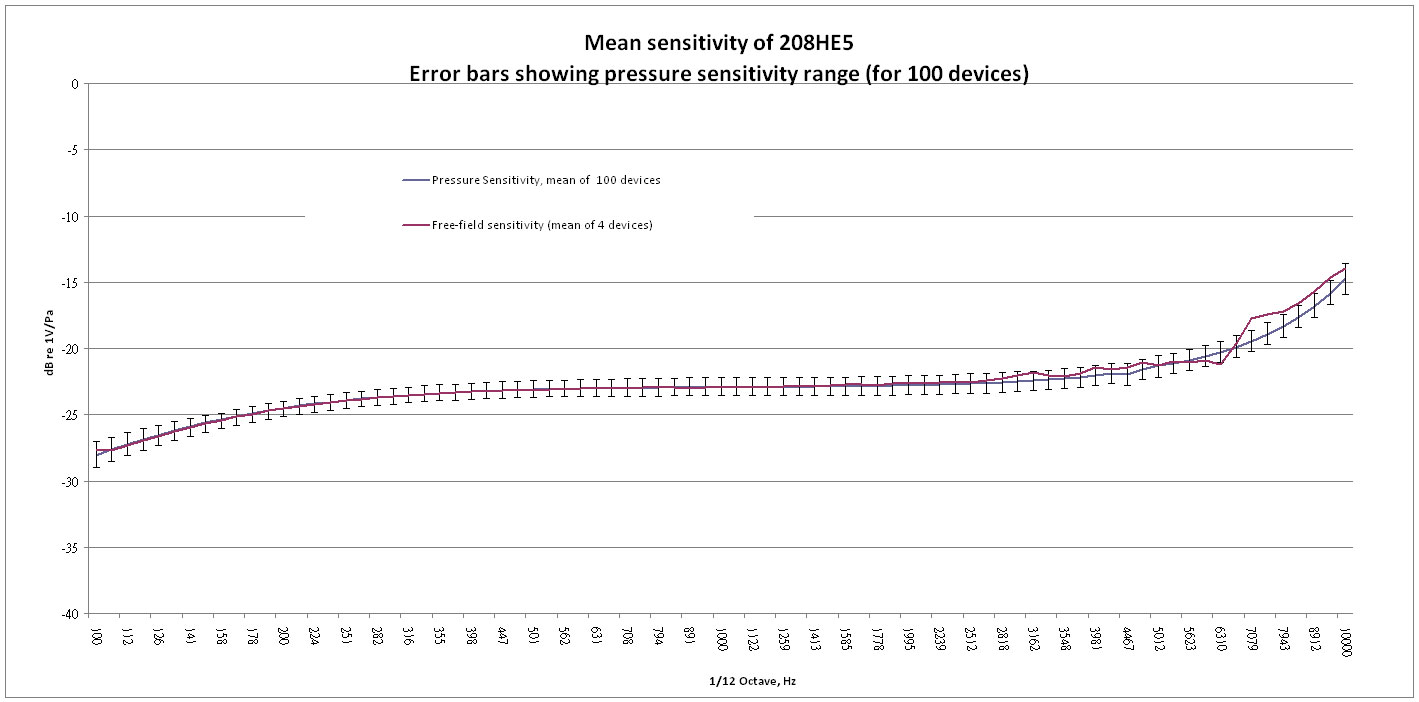
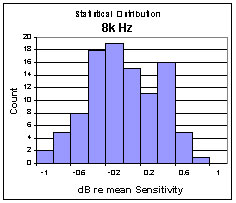
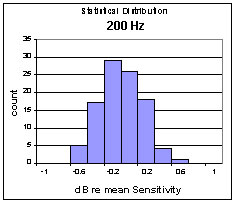
The above presents the mean pressure response sensitivity of the COTS MEMS microphones and the spread of the measurement results. The number of COTS MEMS microphone samples is 100. There is a low frequency roll-off starting at around 200 Hz. The measurements were made using standard condenser microphones as a reference, in conjunction with conventional equipment such as sound level meters or sound analysers. Histograms of typical statistical distributions of the pressure response sensitivities of the 100 microphone samples, at 1⁄12 octave band centre frequency of 200 Hz, 1k Hz and 8kHz, are shown below.
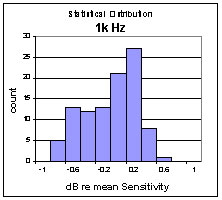
The maximum measured range of variation between devices is 2.3 dB, which occurs at 10 kHz. The minimum measured variation between devices is 1.2 dB, which occurs in the region between 150 and 500 Hz. The variation between devices at 1 k Hz is 1.4 dB.
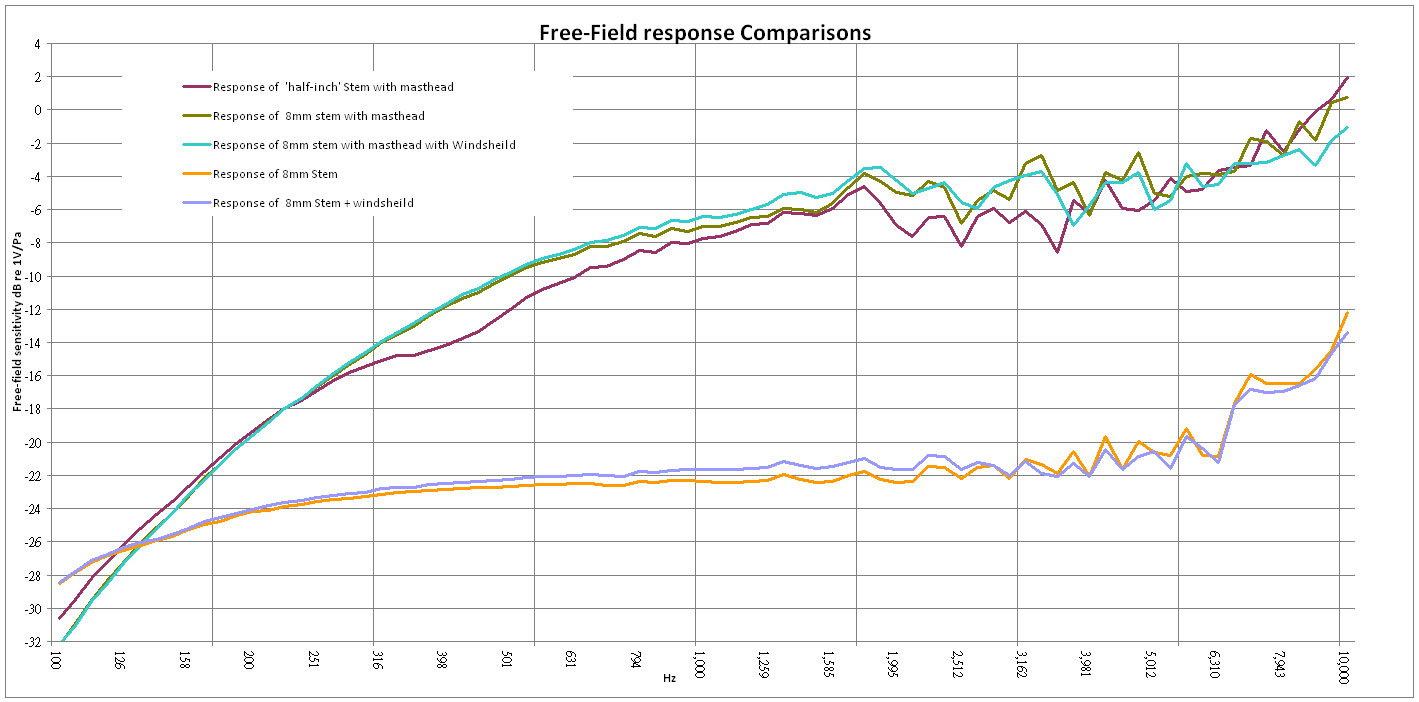
All the following frequency response tests, using the masthead, followed the same test method as the free-field sensitivity tests described above.
Effect of windshield
Free-field responses with and without 3" 'Aco' windshield. Incidence of sound propagation direction was frontal. The blue lines are responses with A-weighting corrections.
Effect of stem diameter
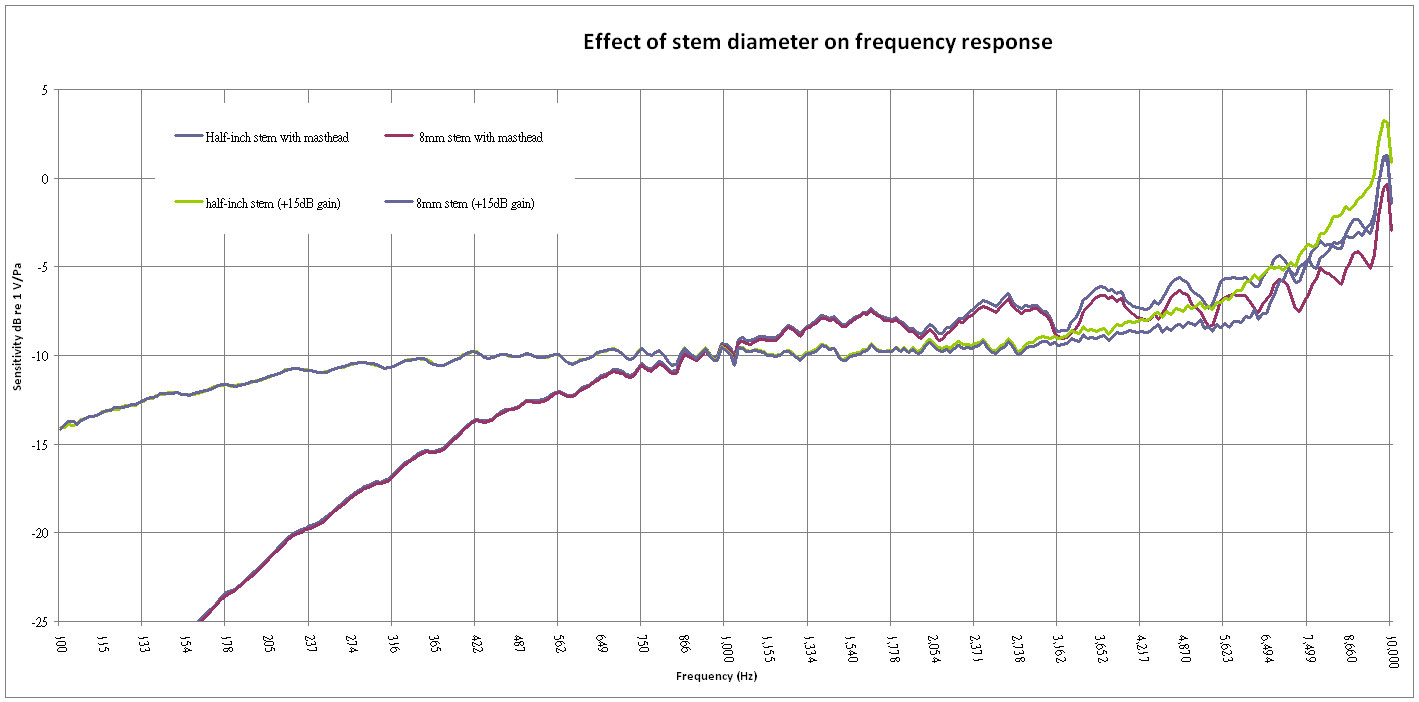
The plotted 'stem' frequency response curve has been 'raised' by 15 dB to allow comparison with the masthead, which has a built-in 15 dB gain. Note that the effect of reflections from the masthead can also be observed in this figure. There is a frequency-dependent increase in sensitivity of the half-inch stem relative to the 8mm stem. Mathematical modelling suggested that it is the lower response, i.e. that of the 8mm stem, that is closer to the ideal response.
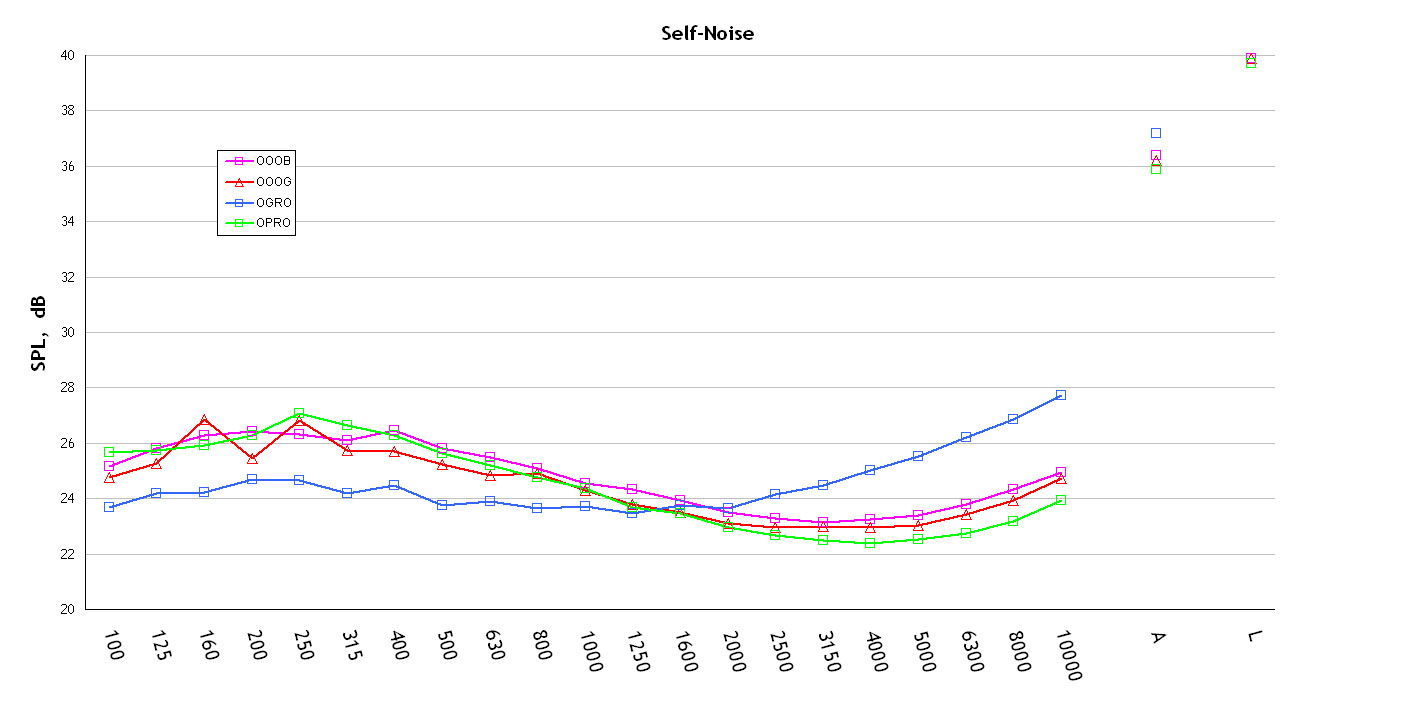
Self noise
Effect of temperature
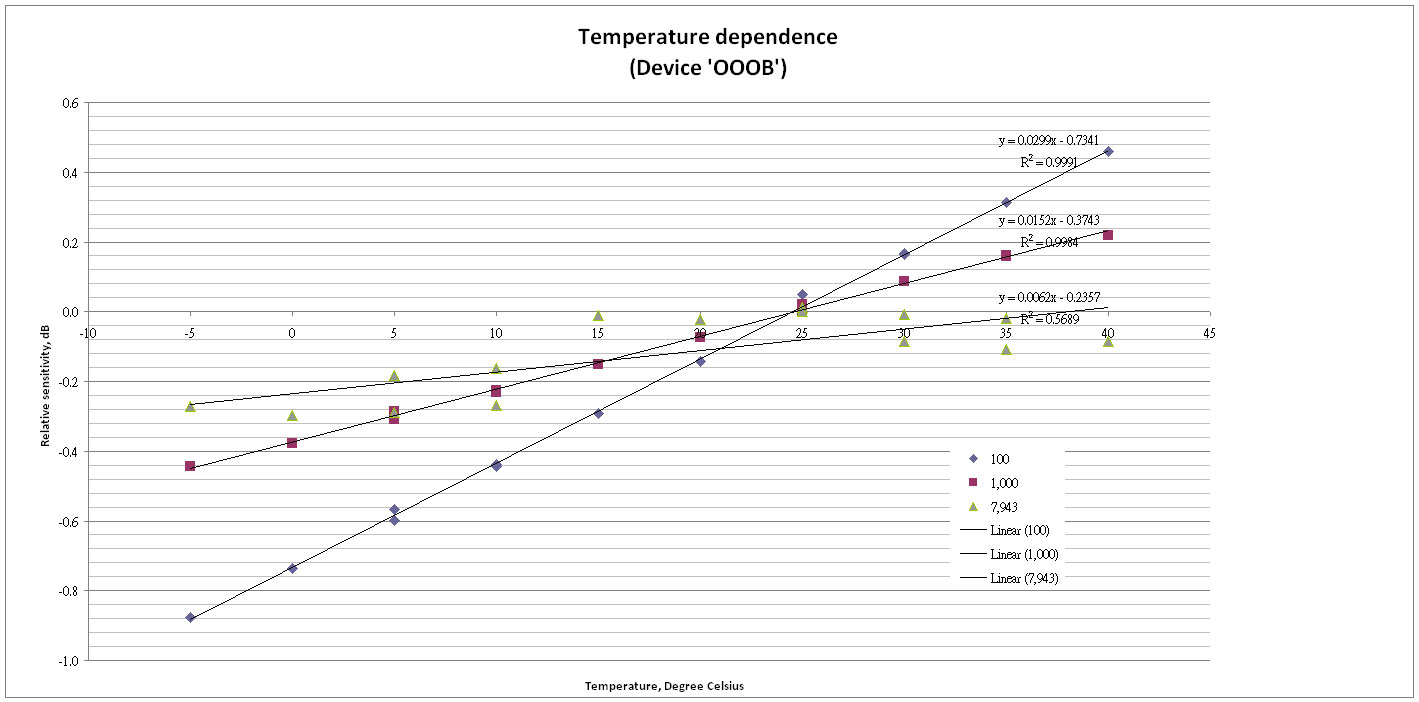
The above shows the gradient of sensitivity change (in dB), as a function of temperature, at 100 Hz, 1k Hz and 8k Hz, for a masthead with MEMS microphone OOOB.
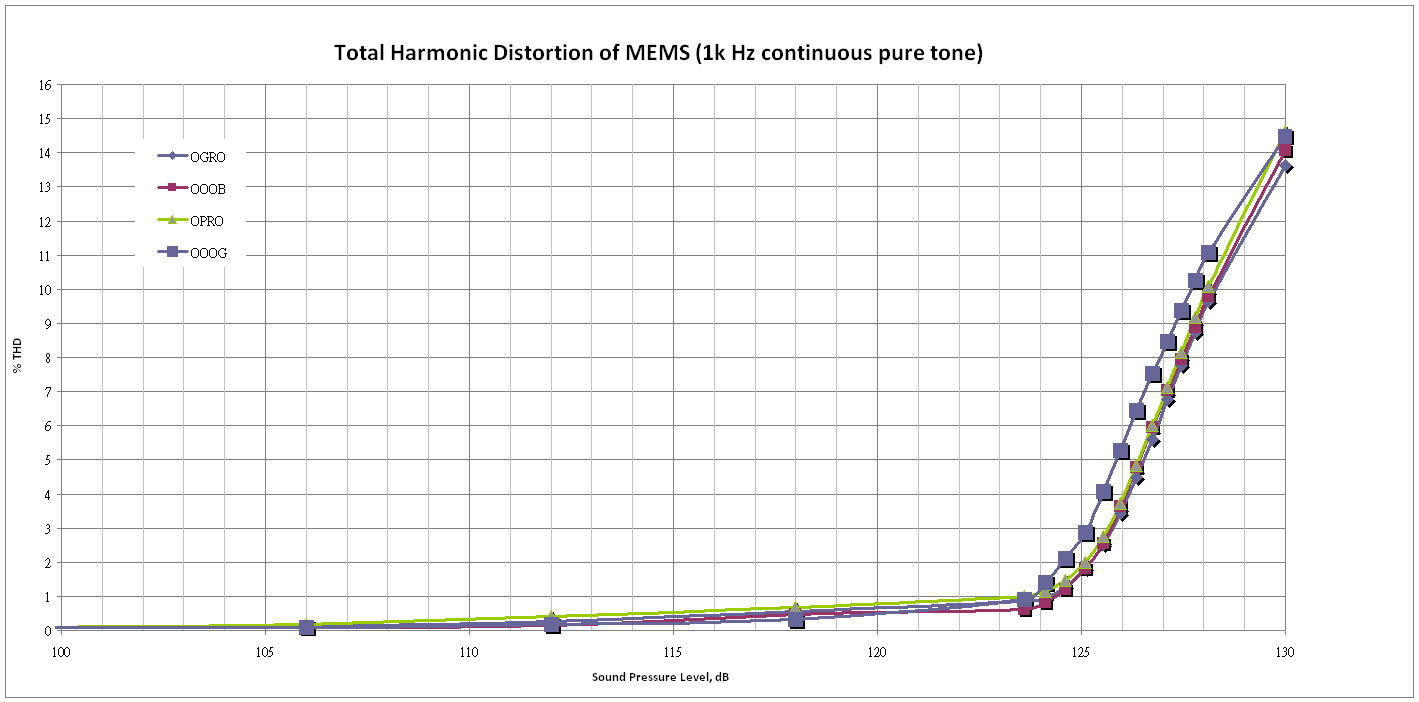
Total harmonic distortion
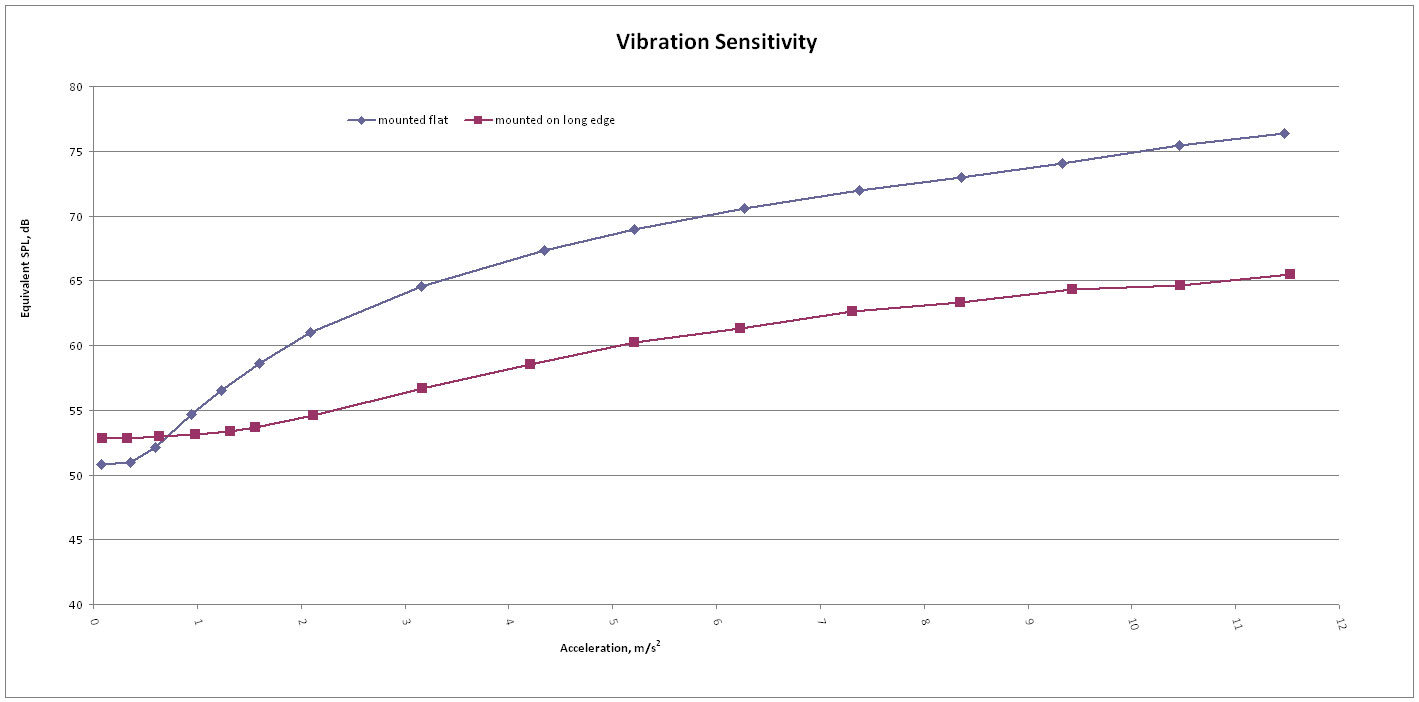
Vibration sensitivity